Basics of GeotIS
Geothermal potentials
GeotIS is based on data from more than 30.000 boreholes, which are mainly oil and gas wells but also geothermal, thermal, mineral water and mining wells. Another component are hydraulic data (porosity and permeability) from the Hydrocarbon Information System created by LBEG, data from project partners and from "Hauptspeicher Bohrungsdaten", which incorporates all the hydrocarbon wells drilled in the former German Democratic Republic. Also incorporated in the system are temperature data from the Geophysical Information System operated by LIAG and structural data from various map series and works of the project partners.
Geological profiles, geothermal maps and information from relevant databases are processed into 3D subsurface models. These models form the main data basis of the information system.
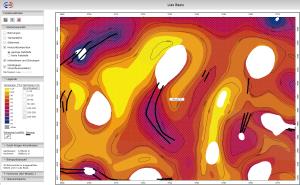
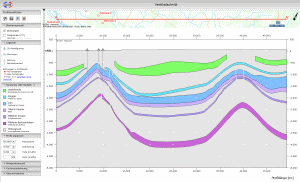
The research in GeotIS is exclusively via the internet. The search interface allows the dynamic generation of interactive maps, where specialized information is combined with topographical and statistical data. Dynamically generated vertical and horizontal sections to a depth of 5000 m below sea level offer detailed views of the subsurface. Technically, a vertical section is a geological profile. Besides the distribution of geothermally relevant stratigraphic horizons the position of nearby wells is presented. Additionally, the temperature distribution can be displayed in form of contour lines. The horizontal section enables you to look at both the lateral temperature distribution and the stratigraphy at a certain depth. Furthermore, it is possible to display the temperature distribution at the base or top of a stratigraphic unit.
Geothermal installations
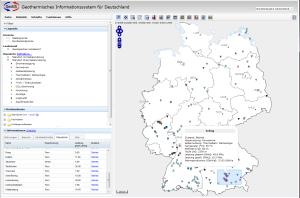
The Geothermal Installations catalog is an internet-based information system on deep geothermal systems in Germany which are presently in operation or under construction. Near-surface geothermal systems are not included. The map interface is based on a map of Germany with administrative boundaries. Furthermore, the user can select individual states by a select box with references to the relevant responsible authority.
If information regarding a specific geothermal installation is available, it can be accessed via mouse click. Different symbols are used for the geothermal installations, referring to their different utilization (balneological use, power generation etc.). The user can choose between different map contents, i.e. topography (DLM 250), energy consumption and population density. The presentation of the installations takes place via MapServer (former UMN MapServer).
Development: The former working group Deep Geothermal Energy of the State Geological Surveys (BLA-GEO) has prepared a list of all geothermal installations in Germany. This table includes geothermal installations in Germany which are in operation, under construction and in planning. However, only installations in operation or under construction are published. Under construction means that at least one well has been completed.
The original data were delivered by the representatives of the State Geological Surveys and are subsequently updated by the working group of the GeotIS project. Accuracy, correctness and actuality of the information are not guaranteed.


 Sprache zu Deutsch wechseln
  Continue in English